Carbacan

Official building data as an interface

One address in.
The real building out.

For every German address geo3d delivers the official LoD2 model of the building — roof surfaces with tilt and azimuth, facade gross and net, volume, storeys, ridge height and eaves height. Not estimated, not derived: from the survey data of the federal states.

View four example addresses without signing up · 3 addresses of your own after e-mail confirmation
Licence per tenant · JSON API and embeddable white-label widget

View of the building at Taunusstraße 16, 61389 Schmitten im Taunus in its terrain, with the neighbouring buildings; the below-grade wall areas are shown hatched, the terrain is cut open on the uphill side. All figures are given as text beside the image.

69.4 %of the facade lie below ground — 223.68 m² of 322.10 m².

4.69 mterrain range along the footprint — from 472.16 to 476.85 m NHN. The house stands on a slope.

-9.13 %less sun on the west roof through shading — 1,017 instead of 924.1 kWh/m²·a.

Taunusstraße 16, 61389 Schmitten im Taunus — the same scene the demo shows, from the same files. On a phone, with reduced motion and in data saver mode it stays with the still image.
All figures of this image
Address
Taunusstraße 16, 61389 Schmitten im Taunus
Building
DEHE06200000MRtF
Facade gross
322.10 m²
of which below grade
223.68 m² (69.4 %)
Terrain range along the footprint
4.69 m — 472.16 to 476.85 m NHN, 526 samples at 0.25 m along the outline; ground slab 472.14 m NHN
West roof
41.02 m², 47.0° tilt, azimuth 249.9°
Irradiation unshaded
1,017 kWh/m²·a
with shading
924.1 kWh/m²·a (-9.13 %)
Terrain extent
150 m radius, 3 m mesh width
Neighbourhood
75 m radius

Geometry: lod2 (as of 2020-03-04). Shading: HE DOM1 (laser, 1 m), HVBG: dom1_32_460_5567_1_he, dom1_32_460_5568_1_he, dom1_32_461_5567_1_he, dom1_32_461_5568_1_he. All values stated are measured; estimates made by the model are not shown by the opening image. The excavation is a depiction: there is no pit there. Loading of the scene: 662 KiB in three files, only after the page has first been laid out and only on a desktop computer.

20,763,162 buildings on file, reported live by the service. GET /v1/health
over 24,000 digitised zone geometries from municipal heat plans. Berlin, Hamburg, potential areas NRW
1,271 municipalities with a recorded heat planning status. GEG §71 / WPG
< 1 s from the address to the complete data set. POST /v1/simulations

Try it on an address you know.

geo3d is most convincing on your own house. You confirm your e-mail address once and then have three complete queries — with 3D model, site plan and location dossier.

geo3d · demo console
What happens to my e-mail address?

We process it solely in order to unlock your access — not for advertising. We store your IP address only as a non-reversible hash value, purely to fend off automated mass use. Unconfirmed requests we delete automatically after 14 days, confirmed accesses after 30 days. You can withdraw your consent at any time without formality to demo@geo3d.services. Details in the privacy notice (German).

On first use you confirm your e-mail address once. After that three address queries are open to you — open in its own window.

Note for the integration: this console is the interface of the white-label widget. Licensees run it without the e-mail gate, with their own theme and their own domain.

What a single query returns

One call, one JSON document. All values come from official sources — state survey, the property cadastre (Liegenschaftskataster), Census 2022, DWD climate data.

For shading we deliver one figure per roof surface, not a traffic-light colour per roof — and we write alongside it what the figure does not contain.

Building geometry · LoD2

Total roof area
184.6 m²
Roof shape
gable roof (Satteldach)
Roof segments
2 · tilt + azimuth
Facade gross
312.4 m²
Facade net
253.0 m²
Gross volume
968.2 m³
Footprint
108.0 m²
Storeys
2
Eaves height
6.20 m
Ridge height
9.40 m

Below-grade facade · from the terrain intersection line

Below-grade share
19.0 %
Area below ground
59.4 m²
Terrain height difference
2.10 m
Relevance
DIN 4108-6 / 18599

Shading · for the photovoltaics assessment

Loss per roof surface
as a percentage · irradiation with and without
Horizon per surface
72 sectors · for DIN V 18599
Level 1 · building model
all 16 federal states
Level 2 · surface model
complete today for Rhineland-Palatinate and first regions in Hesse — more to follow

Parcel · property cadastre

Year of origin
1968
Parcel area
642 m²
Built-up ratio
16.8 %
Site plan 3D
neighbouring buildings

Site plan package · what stands on and beside the plot

Outbuildings
with full metrics
Neighbouring buildings
footprint, eaves height and ridge height
Parcels within the radius
number, cadastral district (Gemarkung), area
Radius
75 m · adjustable up to 150 m

Streets within the radius · with names

Street name
“Ludwig-Erk-Platz”
Class
main road, residential street, track
Geometry
WGS84 and local metres
Address street
flagged separately

Terrain · official elevation model within the radius

Point grid
.xyz and .csv, ready for CAD
Mesh
.glb · same origin as the building
Radius
150 m · adjustable from 25 m
Height reference
absolute (NHN) in the CAD file
Source
DGM1 of the federal states · terrain without buildings or vegetation
Terrain tab
in the demo and in the widget: the building in the official terrain (150 m), neighbours as boxes, below-grade facade named; the intersection is shown, not covered up

Location dossier · climate, surroundings, loads

Elevation (a.s.l.)
312 m
Climate factor GEG §82
1.02
Heating days
248 d
Mean annual temperature
9.4 °C
Global radiation
1,062 kWh/m²a
Snow load zone
2 · 0.85 kN/m²
Census 2022 surroundings
construction decade, heating
Administration
municipality / district / federal state
Upper section of the first page of the PDF building report: header line, address, data date and the upper part of a 3D view of the building, in which the below-grade wall area is set off in its own shade.
Upper section of the first page of the PDF report, as every query delivers it — to pass on to the client.

This exists nowhere else in machine-readable form

Heat planning under GEG §71 — address by address.

Since municipal heat planning (kommunale Wärmeplanung) became binding, the position in the heat plan (Wärmeplan) decides which heating system an owner is allowed to install at all. Today this information sits in the PDF maps of the municipalities. geo3d has digitised it and returns it per address as a field.

Heat network area (Wärmenetzgebiet)

Connection expected

The address lies in the planned network area. A decentralised heat pump is economically the wrong recommendation in most cases.

Assessment area (Prüfgebiet)

Still open

The municipality is examining suitability for a network. Advice has to calculate both paths — with the date of the expected decision.

Decentralised (dezentral)

Your own plant

No network envisaged. Heat pump, biomass or hybrid — the building metrics from the same query supply the sizing.

On file: over 24,000 zone geometries (Berlin, Hamburg, potential areas NRW), plus the planning status of 1,271 municipalities. Expansion to further federal states is under way; licensees receive new zones without a change of contract.

What sits inside a click elsewhere

The values come as data, not only as graphics.

What our 3D view shows when a building is clicked also stands in the response as a data field: the garage on the plot with its roof area and height, the neighbouring buildings with eaves height and ridge height, the parcels (Flurstücke) within the radius, the street names.

Why this counts with public-sector clients

The German accessible information technology ordinance (Barrierefreie-Informationstechnik-Verordnung) requires that information is conveyed not exclusively through graphics and that a function is not triggerable by the mouse alone inside an area. An application in which the neighbour's height sits only inside a click does not satisfy this.

What that means for your interface

With us the same figure additionally stands in the JSON. Your application can read it out, write it into a table or make it accessible via the keyboard — without you having to embed our view. The click interaction stays. It is simply no longer the only source.

What you can demonstrate with it

Tenders ask about the accessibility of the components used. This page can be linked to; the fields are named individually in the interface description at /docs.

What lies beneath the house

The terrain comes as a file, not as an image.

With every simulation we deliver the official terrain model within the radius — in the formats your programs really do read in. Not as a screenshot, not as a PDF: as a point grid for the design engineer and as a mesh for the 3D scene.

Three formats, one charge

.xyz (space-separated) for ArchiCAD — its file dialogue knows only .txt and .xyz. .csv (comma-separated) for Revit, as a point cloud for the toposolid. .glb for the 3D scene in the browser and for Rhino. .xyz and .csv carry the same content; only the separator and the extension differ. All three together are one retrieval: whoever fetches the terrain once gets every format at no further cost.
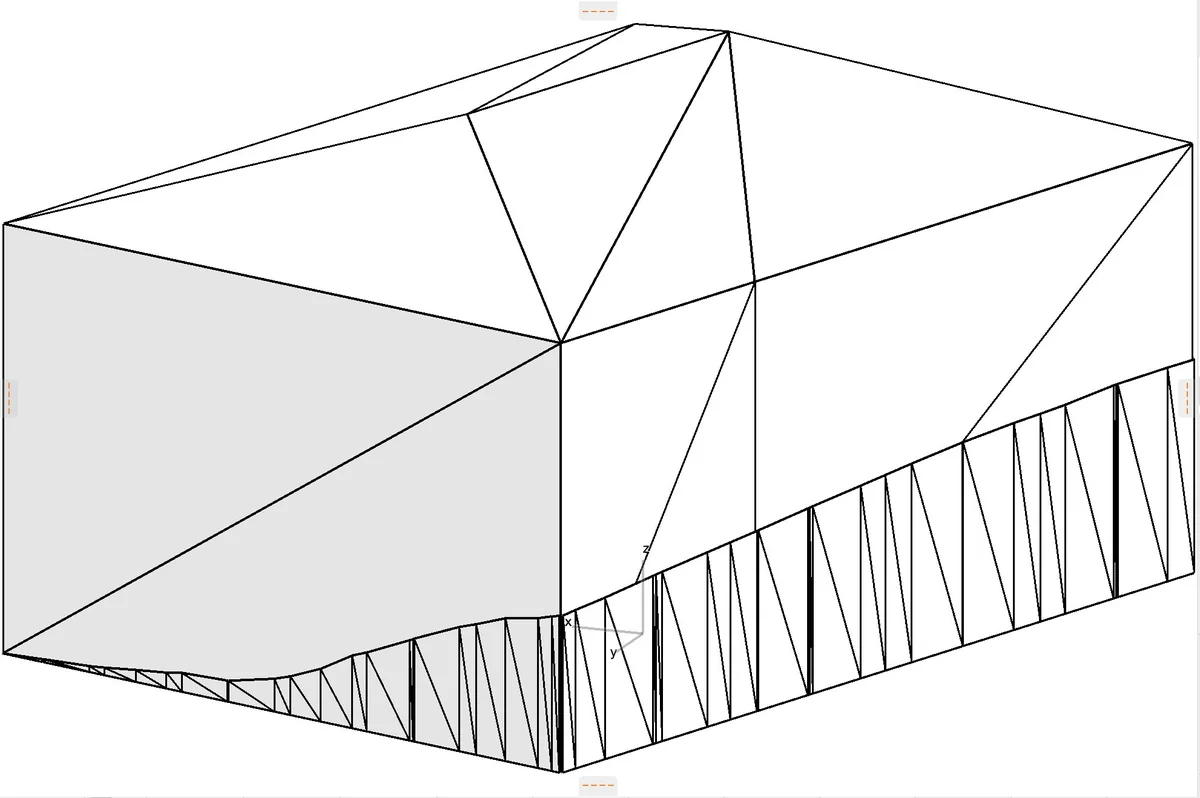
Screen capture from ArchiCAD: the delivered building model as a white model with shadows, seen obliquely from the valley side. A jagged band runs around the house at the foot of the wall — the below-grade wall area that comes with the file.
Our export.dxf, opened in ArchiCAD — white model with shadows, no rebuild. The jagged band at the foot of the slope is the below-grade wall area. The file brings 222 surfaces on 7 layers with it (BODEN, DACH_00, DACH_01, DACH_02, DACH_03, ERDREICH, WAND).
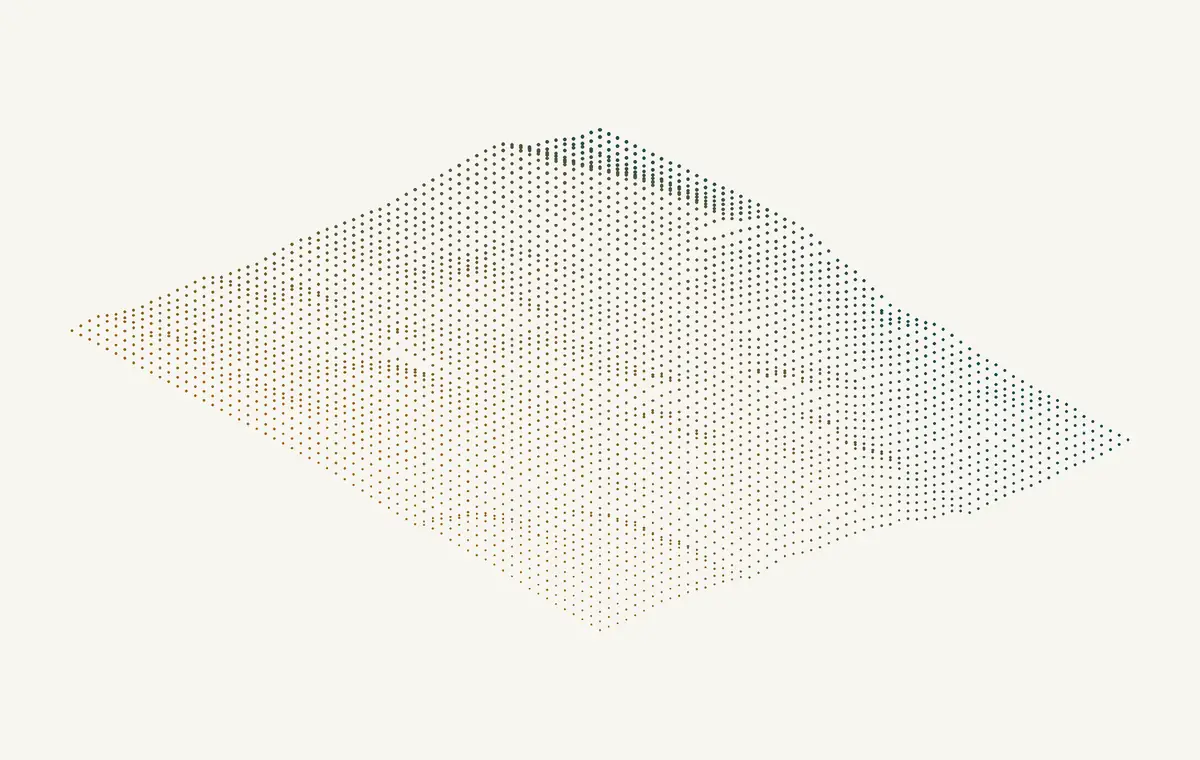
Point cloud of the official terrain model in an isometric view; the points form a slope, the colour rises with the elevation.
The delivered terrain.xyz, rendered — 3,721 points on a 2.0 m grid, 60 m radius, 24.17 m difference in elevation. DGM1: terrain without buildings and without vegetation.

The number of points is not a matter of taste

At a 150 m radius we deliver 7,569 points on a 3.5 m grid, at 75 m 5,776 points on a 2 m grid. That is coarser than our data are — and the reason does not lie with us: Revit 2024 and 2025 reduce a point cloud, when a toposolid is created, without a warning down to 10,000 points. From version 2026 the limit is adjustable. As long as 2024 and 2025 are on the market, we deliver below it — a file with 22,801 points would look on opening as delivered and would arrive thinned out, and nobody would have noticed. The mesh does not have this limit: it goes into the browser, not into Revit's point cloud path, and at 150 m delivers a 1 m grid with 90,601 points — four times finer than the CAD file.

Where the axes lie — and why not the same everywhere

Easting and northing are local metres around the model origin in all formats. The height is in .xyz and .csv absolute in m above NHN, in the .glb relative to the model origin. Both are intended: the CAD file is often opened without an accompanying document, and there NHN is the convention of the surveying formats. The mesh ends up in a scene in which the building model already lies with a local reference — absolute heights would place the terrain 151 metres above the house. The shared origin is supplied in both cases: terrain, building and neighbouring buildings lie on top of one another without any transformation.

The terrain tab — the same terrain, just to look at

Anyone who does not want to open the files themselves sees the same terrain in the browser. In the demo and in the widget the building stands in the official terrain, the neighbouring buildings as boxes beside it, and the below-grade facade is named; the opening view shows terrain, neighbours and house together. Where the slope cuts the wall, the intersection is shown, not covered up — it is the same cut edge the below-grade wall area in the table above comes from.

What the terrain does NOT contain

The DGM1 is a terrain model: the ground surface, without buildings and without vegetation. It shows the slope on which the house stands, and the hollow behind it — not the neighbouring house and not the tree. Where no elevation is available, the point is missing; we never insert a value we do not have.

The terrain is currently available at our example addresses. For your region, ask us — the preparation is under way. The rollout carries on, address by address — tell us which region you need.

Fine point: the 3.5 m grid spans ±150.5 m instead of ±150.0 — 87 points per axis do not divide evenly at 3.5 m spacing. We keep the number of points constant, not the round radius; the number of points is the quantity Revit's limit hangs on. The 1 m mesh spans exactly ±150.0.

How the house fits into the street

Street elevation: the neighbourhood, seen in height.

The footprint says how wide the building may be. How high it may go without falling out of line is something only the elevation says: the terrain profile along the street axis, both building lines, and the houses on both sides of the street, each at its own level.

What the Street elevation sheet holds

The axis is the centre line of the address street from the official street network, joined across tile seams and cut around the building. On it lies the terrain profile from the DGM1, station by station. Added to that is the terrain on both building lines (±12 m from the axis) — the line where the ground meets the front gardens. The buildings on both sides of the street stand as LoD2 boxes with a schematic roof, each on its own ground plate, rather than all on one imagined plane.

Three extensions, one charge

.json holds the numbers: axis, stations, levels, buildings with station, front, eaves, ridge, ground. .dxf is the CAD drawing in the R12 format, which older programs open without a detour. .svg is the finished sheet — site plan, legend, and both sides of the street on one page, as pictured below. The three belong together: the terrain family counts once per simulation. Whoever fetches the terrain model and the street elevation for the same simulation pays for one retrieval; every follow-up retrieval — every further extension, every repeat — is free.

A street elevation sheet: at the top a site plan with the street axis drawn in blue and the footprints of the counted houses, below it a legend, below that two long elevations — one per side of the street. In the elevations a row of boxes with pitched roofs stands on a sand-coloured terrain area that falls away to the right; one box is highlighted in orange, the simulated building, labelled with eaves, ridge and ground.
Street elevation as delivered — street_elevation.svg, Taunusstraße in Schmitten im Taunus — no mock-up, but the file the service returns. Axis 240.00 m (±120 m around the building), 244 stations at 1 m spacing, 107 buildings within 40 m of the axis: 57 on the West side, 50 on the East side. The simulated house lies at station 113.82–128.47 m, 4.03 m from the axis.

Open the sheet as SVG

What it is needed for

In the preliminary design the sheet answers the question that always comes up at the first meeting: how does the design fit into the street scene? In the building application it carries the height development of the street and the connection to the terrain — both otherwise laboriously gathered from separate figures. And because terrain, building and neighbouring buildings share one origin, the sheet fits everything else delivered for the same address, without conversion.

What the Street elevation is NOT

These limits travel with the file: they stand in the response as well as in the legend of the sheet:

  • Buildings are LoD2 boxes from footprint, eaves and ridge height — no facades, no openings; roofs are drawn schematically as a gable between eaves and ridge height, the roof shape is an attribute.
  • Terrain is the DGM1 (ground without buildings and vegetation), 1 m grid, bilinear interpolation — no accuracy guarantee.
  • Each building stands on its LoD2 ground plate; where none is stored, on the lowest DGM1 height at its footprint corners.
  • The street axis is the basemap.de centre line, joined across tile seams; it is a position line, not a surveyed kerb.
  • A building counts when a footprint corner lies within 40 m of the axis; buildings whose centroid lies more than 100 m from the axis are not searched.
  • The right-hand side is drawn in stationing direction, not mirrored.
  • Heights in m above sea level, DHHN2016 (Germany).
  • The rule for the tile seam is calibrated at one seam, not measured across the whole stock.
  • Germany only. Denmark and France do not run over this route.

Who works with it

Energy consulting

Survey without a site visit

Envelope areas, below-grade shares and the climate factor arrive pre-filled in the software. The consultant corrects instead of measuring.

Municipalities & utilities

From the plan to the building

Your own heat plan becomes queryable — for citizen enquiries, connection potential and the prioritisation of entire streets.

Property finance

Property assessment inside the process

Volume, building age indication (Baualtersindiz) and heat plan position already in the application — refurbishment risk becomes assessable before a surveyor drives out.

Check before it counts. Whether an address exists in our holdings is answered by a query of its own — free of charge and without using up quota. Whoever imports address lists or guards an input field against typing errors checks first and then queries only the hits.

Two routes into your product

Whoever has an interface of their own takes the API. Whoever wants to go live quickly embeds the widget — shadow DOM, own colours, no collision with your CSS.

1 · JSON API
# Address in, complete data set out
curl -X POST https://geo3d.services/v1/simulations \
  -H "X-Api-Key: <your-key>" \
  -H "X-Tenant: your-tenant-id" \
  -H "Content-Type: application/json" \
  -d '{"address":{"zip":"35578","street":"Ludwig-Erk-Platz","housenumber":"3"},
       "options":{"include":["context_buildings","parcels","streets"]}}'

# → building, parcel, siteplan, model, viewer,
#   parcel_buildings, context_buildings, parcels, streets, dossier
2 · White-label widget
<!-- One script tag, one container -->
<div id="geo3d"></div>
<script
  src="https://geo3d.services/static/widget/v1.js"
  data-tenant="your-tenant-id"
  data-theme="accent:#007dc8;radius:0"
  data-lang="en"></script>

// Shadow DOM — your CSS stays untouched.

Your scene, without projection knowledge. The response names the origin of the 3D model in both forms — UTM with its reference system and longitude/latitude — and the axis orientation with it. Whoever places the building into a scene of their own needs no coordinate library for it and does not have to know the UTM zone. The streets come in the same local metres, so they lie in the right place without conversion.

The neighbourhood as a ready-made backdrop. A single retrieval delivers the surrounding buildings as a 3D model in the same origin — simplified volumes, no LoD2 of the neighbours. For the shading view or the site plan in a renderer of your own that is enough; for a statement about the neighbouring building itself it is neither intended nor suitable.

The key stays server-side: the widget authenticates through a tenant-bound origin check, not through an API key visible in the browser. How it looks in your colours you see at once: widget configurator (German) — preview with real data, ready-made embed code to copy, without signing up.

The portal — fixed prices, start straight away

For architects, expert surveyors and energy consultants who retrieve information by hand: sign in, enter the address, download the report. Without set-up costs, cancellable monthly. Every successful address query counts once — model, PDF, DXF and dossier with it are included. Unsuccessful searches cost nothing.

Starter
19 €per month · 10 queries
  • Full data scope per building
  • PDF report, DXF/OBJ, 3D model
  • To get acquainted and for occasional cases
Professional
49 €per month · 50 queries
  • Everything from Starter
  • For the running expert-surveying and consulting business
  • Under 1 € per building
Business
149 €per month · 250 queries
  • Everything from Professional
  • For practices with high throughput
  • More than 250 a month? Then the API connection is worth it ↓

All prices net plus VAT, an offer to businesses (§ 14 BGB). Annual payment: two months free (190 / 490 / 1,490 € per year). Quota per calendar month — all conditions and counting rules in detail (German). Request access: info@geo3d.services — online booking follows shortly. Try it beforehand: free demo — four examples without signing up, 3 addresses of your own after confirmation · API documentation.

Licence per tenant — annual price or by usage

For the integration by widget or API in your own product. You decide whether you want to be billed predictably or growing along with usage. Both cover the same data scope; what differs is volume, support and expansion stages.

Pilot
Trial phasetime-limited, with a target date
  • One tenant, one key
  • Full data scope
  • Widget and API
  • Limited query volume
Annual licence
Fixed priceper tenant and year
  • Agreed annual quota
  • Widget in your own branding
  • New heat plan zones included
  • A named contact with a response time
Usage-based
per querytiered by volume
  • Billing by actual retrievals
  • No minimum term in the first year
  • For fluctuating business
  • Monthly billing

All prices net, B2B under §14 BGB. We name concrete figures after a short conversation about volume and intended use — the span between 500 queries a year and 500 a day is too wide for a price list.

Frequently asked questions

Where exactly does the building data come from?

From the official LoD2 building models of the state survey authorities and from the property cadastre. The values are surveyed, not estimated from aerial images. Where a federal state does not yet publish LoD2, the API returns that honestly as missing instead of guessing.

How up to date is the heat planning?

The zone geometries are digitised from the published municipal heat plans. Every data set carries the planning status and the date of the decision with it, so that in a consultation you can say what the statement rests on.

What about data protection?

geo3d processes building and parcel data, no personal data. The address queried is used for the response and is not linked to persons. For licensees we conclude a data processing agreement under Art. 28 GDPR. Operated in Germany.

Can we take the data over into our own calculation model?

Yes, that is what the API is built for. You get envelope areas and segments individually, not just a summary — you can carry on calculating with them directly to DIN 18599.

How long does the integration take?

The widget is a script tag: one afternoon including agreement on the colours. An API integration into an existing specialist application we usually plan with one to two weeks on your side.

Request access

One conversation, then a key.

Tell us which product is to receive the data and what volume you expect. We set up a tenant with an API key of its own, so that you can test on real addresses.